Can I print 4 quadrant graph paper with numbered axes for free?
A4 paper. Squares are 1 cm, 18 across and 26 down, with the axes in the middle.
Yes, this page prints 4 quadrant graph paper with numbered axes. Choose a square size and the sheet appears beside your choice, with a bold x axis and y axis crossing in the middle. The axes are numbered from 0 at the center, positive to the right and upward and negative to the left and downward. On Small squares every second line carries a number. Print it on Letter or A4, or keep a PDF, PNG or JPG file. It is free, with no sign-up.
More settings
Four quadrant graph paper is a square grid split into four parts by an x axis and a y axis. Choose a square size here and the sheet is made for you, with both axes numbered from 0. Print it, or keep it as a file, at no cost.
How to print 4 quadrant graph paper
Choose the square size
Press Small, Medium or Large. Letter paper gets 1/4, 1/2 or 1 inch squares, and A4 gets 5, 10 or 20 mm squares. Medium is selected to begin with.
Check the sheet beside the choices
The sheet shows the bold x and y axes, the numbers on each axis and 0 at the center. Look it over and change the square size if you want more or less room.
Print the sheet
Press “Print 4 quadrant graph paper”. Before you print, make sure the scale reads 100%. Then each square is its true size on the paper.
Save a copy if you want one
Choose Save as a PDF for a file to use later. More settings also has PNG and JPG pictures, with the numbers included.
Gather what you need before printing
Write your ordered pairs in a short list first, such as (2, 3), (-1, 2) and (-2, -1). Look at the largest and smallest numbers in the list. If every value stays within a few units of 0, Medium or Large squares leave room to write and shade. If the values reach far from 0, Small squares give the most room. On Letter, the x axis runs 15 units each way on Small squares, 7 on Medium and 3 on Large. The y axis runs 20, 10 and 5.
Have a sharp pencil, a ruler and an eraser ready. A fine pencil keeps points small enough that two neighbors on adjacent lines never blur together. A colored pencil is handy for a second line or a reflected shape.
Know the four quadrants before you plot
The sign of each number tells you where a point lands. Read the pair as “across, then up or down”.
A point with a 0 in it sits on an axis and belongs to no quadrant. The point (0, 3) is on the y axis, and (-2, 0) is on the x axis. Marking these first often helps younger students see why the axes are bold.
- Quadrant I: x positive, y positive. Right and up.
- Quadrant II: x negative, y positive. Left and up.
- Quadrant III: x negative, y negative. Left and down.
- Quadrant IV: x positive, y negative. Right and down.
Pick the square size for the job
Match the squares to the person holding the pencil. Someone learning to plot a first point will be more comfortable on Large squares, where a dot is easy to place on a crossing. A middle school class working on a table of values for a line usually does well on Medium. A student plotting twenty points for a scatter plot, or drawing a curve that must stay smooth, will want Small squares.
On Small squares only every second line carries a number. Count the unlabeled lines by twos in your head, or lightly pencil in the missing numbers the first time. After that, reading the axes becomes automatic.
Set up a class with a stack of sheets
Print one sheet per student, plus a few spares for mistakes. Handing out a single page for each exercise keeps the work uncluttered, so a reflection problem does not share space with a slope problem. If a worksheet has four parts, print four sheets and label each with the exercise number at the top in the margin.
For a quick warm-up, read out a list of points and ask students to name the quadrant before they plot. Then have them plot and check. Saying the quadrant first builds the habit of reading the signs.
Graph a line from a table of values
Write three or more x values in a column, work out each y value, and plot the pairs. Place a ruler along the points and draw through all of them, extending to the edges of the paper. If the points do not fall on one straight line, a value in the table needs a second look.
The two places a line crosses the axes are useful to mark. Where the line crosses the y axis, x is 0. Where it crosses the x axis, y is 0. Circle both and write the pairs beside them.
Draw shapes and reflect them
Plot the corners of a triangle or a quadrilateral, join them in order, and shade the inside lightly. To reflect the shape across the y axis, change the sign of every x value and plot the new corners. To reflect across the x axis, change the sign of every y value instead. A different colored pencil for the image makes the pair easy to compare.
To slide a shape, add the same amount to every x value, every y value, or both. Plot the shifted corners and draw arrows between matching corners to show the move. A rotation of a half turn about the middle changes both signs at once.
Make a coordinate picture
A picture drawn from points gives practice with negative numbers in a way that feels like a puzzle. Sketch a simple outline on one sheet, mark each corner, and write the pairs in order on a separate page. Hand the list to a friend or classmate, who plots the points in order, joins them, and sees the picture appear.
Keep the design inside all four quadrants so every sign gets used. Number the points so the order is clear, and mark the start of a new line with a note such as “lift the pencil here”.
Choose your own scale
The axis numbers count one unit per line. When the values you need are larger, such as 10, 20 and 30, write your own scale in pencil next to the printed numbers. Or work with a coarser count, where each line stands for 5 or 10. Label the axes with what they measure, and write the scale in a corner so a reader never has to guess.
The two outer lines in each direction have no printed number. That leaves a clear spot for a unit label or a note about the scale.
Check your work
After plotting, read each point back from the paper. Start at 0, move along the x axis by the first number, then up or down by the second. Compare what you read with the list. Common slips are swapping the two numbers and forgetting that a negative x moves left.
For a graph that will be handed in, go over the axes and the final line in pen once the pencil work is checked. Write the name and date in the margin. Keep a saved PDF of the blank sheet so a new copy is always one print away.
FAQ
What are the four quadrants of graph paper?
The x axis and y axis divide the paper into four quadrants. Quadrant I is upper right, where x and y are both positive. Quadrant II is upper left, III is lower left and IV is lower right, counted counterclockwise from the upper right.
Is 4x4 graph paper quarter inch?
Yes. Four squares to the inch means 1/4 inch squares. On Letter paper, Small squares are exactly 1/4 inch, so four of them fit in one inch. On A4, Small squares are 5 mm, a little under 1/4 inch.
Can I choose the paper size and square size before downloading?
Yes. There are three sizes. Letter and Legal give 1/4, 1/2 or 1 inch squares; A4, A3 and the square page give 5, 10 or 20 mm squares. The axis numbers are added for you, and you can keep the sheet as a PDF, PNG or JPG.
Are the axes numbered on the printed sheet?
Yes. Numbers run from 0 at the middle: positive to the right and upward, negative to the left and downward. The letters x and y mark the ends of the axes. On Small squares every second line is numbered. The numbers also appear in the PDF, PNG and JPG files.
Why are some lines on the axes not numbered?
On Small squares every second line is numbered, so the labels do not crowd each other. On every size the two outer lines in each direction have no number. You can write your own scale there if you need one.
Is the graph paper free, and do I need an account?
The paper is free to print and save, with no sign-up. Nothing needs installing, and it works on a phone, a tablet or a computer.
Updated
Related tools
- 10x10 gridPrint a blank 10x10 grid with 100 squares in three sizes. Add numbers 1 to 100, then print the sheet or save it as a clear PNG.
- 8x8 gridPrint a free 8x8 grid of 64 squares in your browser. Pick Small, Medium or Large squares, add letters and numbers, then print or save a PNG.
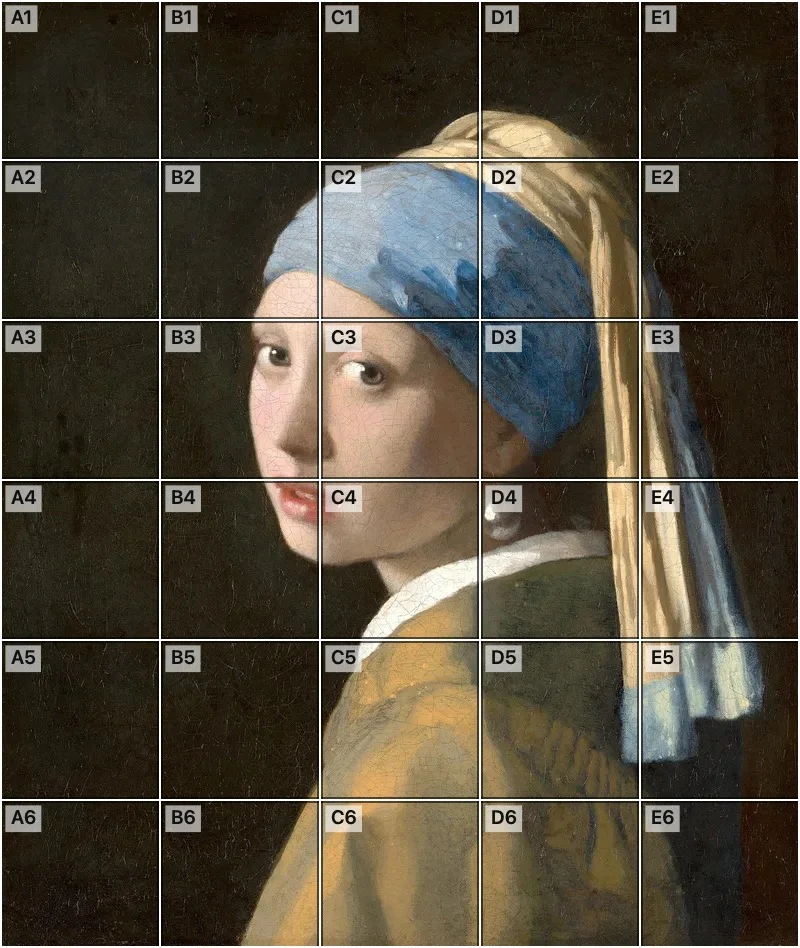 Add grid to photoAdd a grid to any photo in your browser, with no sign-up and no watermark. Get a numbered grid or a plain grid overlay, then save it or print it at true size.
- Ar TracingInstead of ar tracing with a phone stand, put a numbered grid on your own photo, then save or print it and copy it square by square. Free, no sign-up.
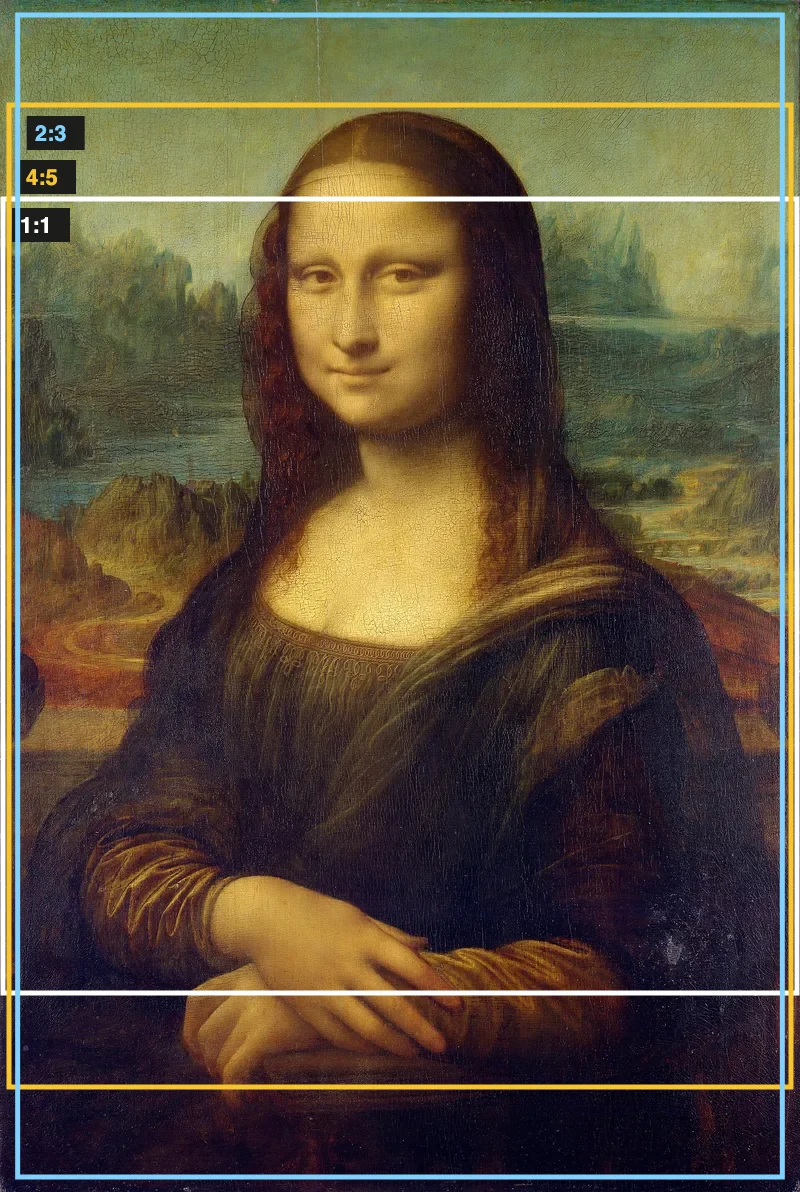 Aspect Ratio CalculatorUse this aspect ratio calculator to turn a width and height into a ratio like 16:9. You also get the decimal and a resize that keeps the shape.
- Atmospheric PerspectiveAdd a numbered grid to a photo and compare near and far squares to see atmospheric perspective: lighter values, softer color. Free, in your browser.
- Bargue DrawingPractice Bargue drawing from your own photo: add a numbered grid with 5, 8 or 12 squares across, then save it or print a gridded sheet and an empty one.
- Baroque DiagonalLay a 3 by 3 grid over your photo to see where a baroque diagonal runs, from lower left to upper right. Save it or print two sheets, free.